
Introduction
The Live Monitor module allows a quick access overview of device activity and sales in real time through the Live Monitor button. The sales monitor home screen will give you a list of the devices on site. Use this to check if a device has been communicating with the Way2Pay network via heartbeat.
Sales/Live Monitor Screen

Sales Monitor Explained
| Column 1, 2 & 3 | Devices name, type and location |
| Column 4 | Last date and time the device successfully communicated with the Way2Pay network |
| Column 5 | Indicate network status |
| Column 6 | Number of operators logged on to a device at any given time |
| Column 7 | The balance of transactions on the device the last opening of the shift on the device. |
| Column 8 | The status of the device Open or Closed |
To access an account, select “more info” next to the account.

Network Status Indicators
Understanding the Sales Monitor Screen
The different coloured circles and symbols are indicators of the ‘health’ of the network connections between devices and the Way2Pay servers.
What the symbols mean
 |
Device has a healthy network connection and has successfully communicated with the Way2 network when Heartbeat has been sent and received. |
 |
Device is offline. Session has been closed. No connection can be established between device and Way2Pay network. Often indicates device has been turned off and disconnected at the end of day. Sites are always advised to leave devices connected to the network to allow for maintenance and software updates. |
 |
Device has failed to return first attempt at heartbeat. Monitor and review in 15 mins in case of serious problems. |
 |
Network Error requires urgent attention. Indicates that a return heartbeat has not been received from a device when requested and that the system has gone offline before the session has been closed. Refer to network troubleshooting guides. |
Device Specific Monitoring
You can review the status of an individual device within a site simply by clicking on the required device in the sales monitor module. Options available to you to then review are as follows:
Vital Signs
A snapshot of transaction history from the selected device. Contains information on:
- Average sales
- Total sales amount
- Average refund amounts
- Number of refunds
- Total refunds amount
- Number of sales

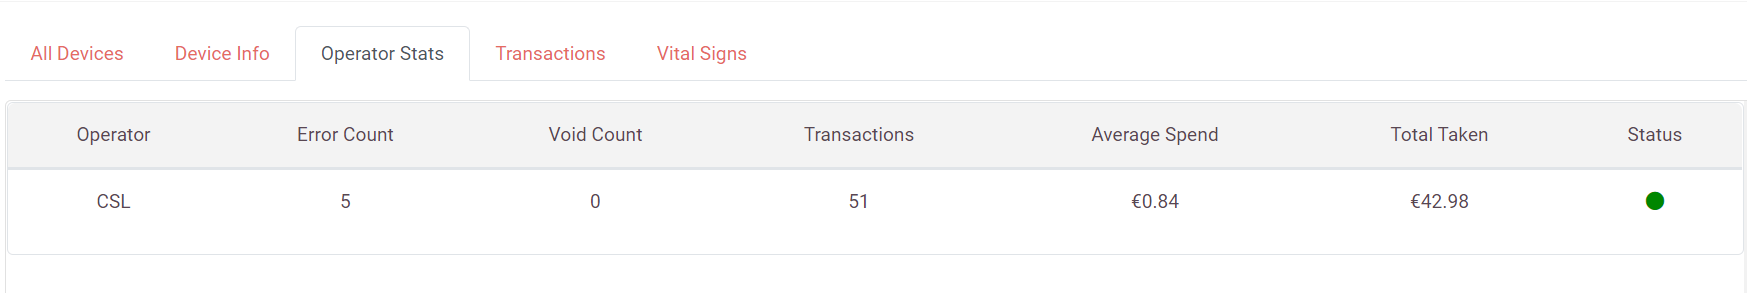
Operators
Provides insight into current operators and their performance. Contains information on:
- Operator name
- Number of errors
- Number of voids
- Number of cancelled transactions
- Number of transactions
- Average spends
- Total amount taken
- Current active status of operator
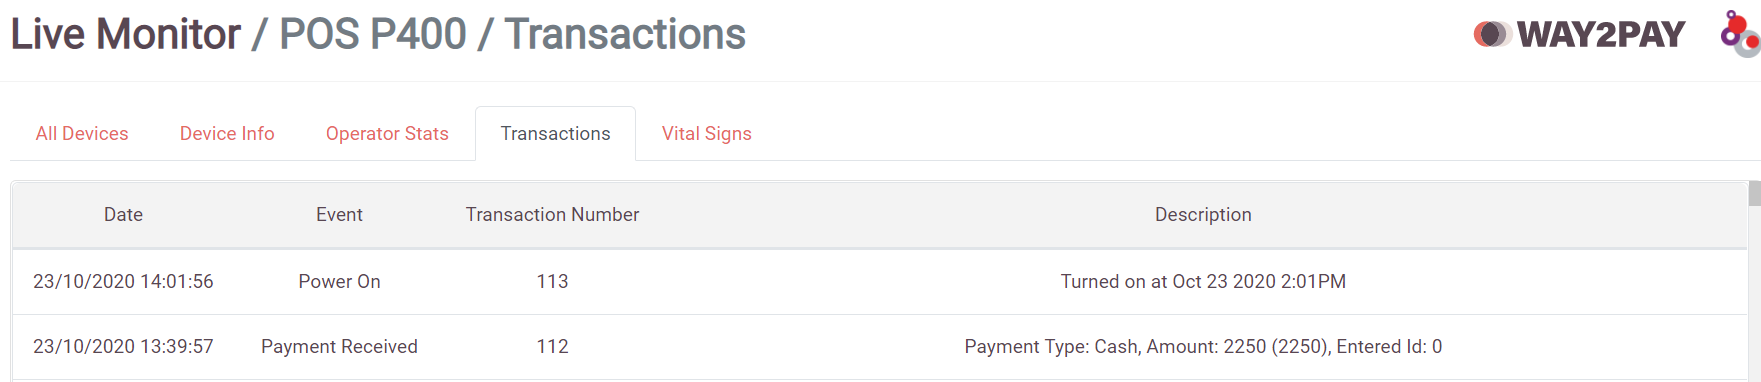
Transactions
Review transaction history in real time. Allows you to see the time of the last recorded transaction and establish the point that a network connection may have been broken. Contains information on:
- Transaction date
- What the transaction ‘event’ was e.g. payment type, item entered, power on and sales.
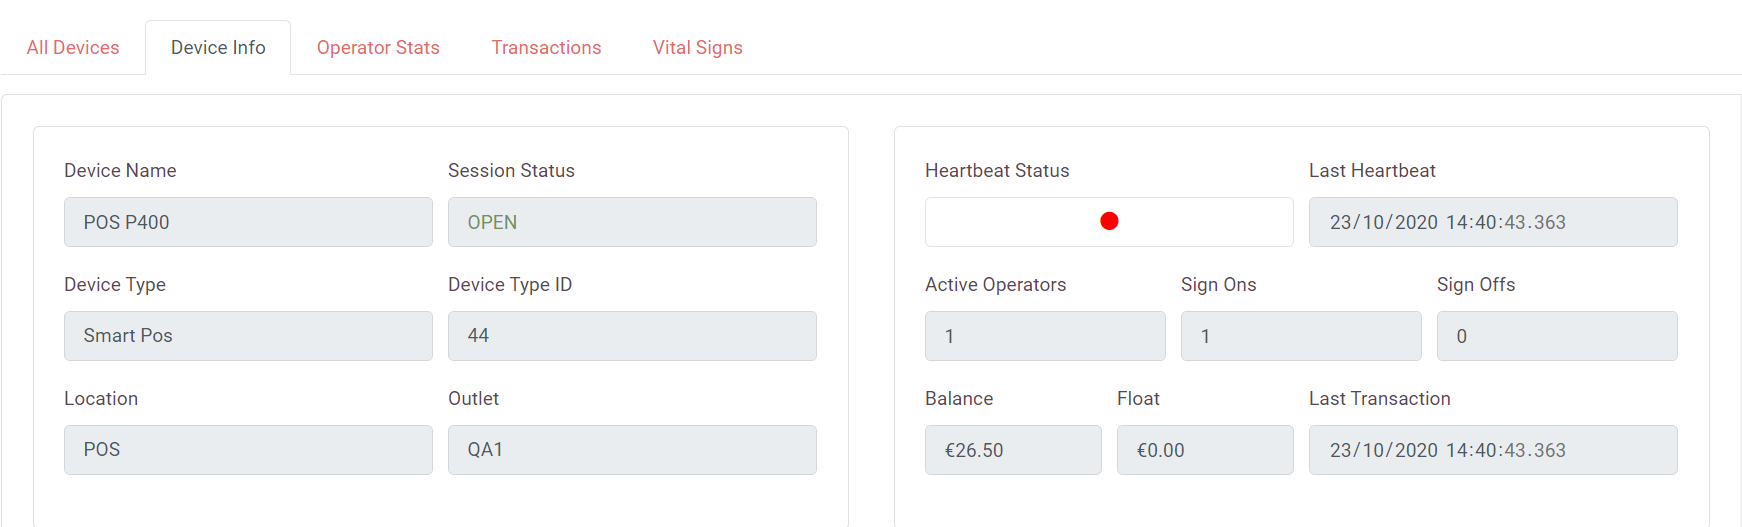
Device Info
An overall snapshot of the device, its status and activity. Contains information on:
- Location of the device
- Device type
- Number of sign on occurrences
- Device Type ID
- Heartbeat status
- Last time the device was powered on
- The outlet
- The float placed in the device
- Last time the session was opened
- Time of the last transaction
- Device name
- The device ID
Use live monitoring as a tool to establish if there are immediate issues that need attention or to review live stats of a device or user.